GO-5232/9255, PI: L. A. Kwok
Getting Late Early: Mid-Infrared Spectroscopy of White Dwarf Supernovae
NASA Hubble Fellow · CIERA — Northwestern University
Getting Late Early: Mid-Infrared Spectroscopy of White Dwarf Supernovae
So Close, Yet So Faint: NIR+MIR Spectroscopy of the Nearest SN Iax 2024vjm
Cracking the Cosmic Calcium Conundrum: discovering the origin of Ca-rich transient SN 2024uj with late-time infrared spectroscopy
See Through Supernovae: Nebular Spectroscopy of Exploding White Dwarfs

Saarah Hall, a Ph.D. student at Northwestern University, is analyzing a late-time near-infrared JWST spectrum of SN 2024uj, a member of the rare and enigmatic class of calcium-strong transients. The origins of these explosions remain highly uncertain—we don’t yet know whether they arise from white-dwarf detonations or the core collapse of massive stars. The data reveal the first detection of carbon monoxide in such an event, a molecule that serves as a precursor to dust formation in the ejecta. To learn more, check out Saarah’s poster.

Michaela Schwab, a Ph.D. student at the University of Virgina and former undergraduate at Rutgers University, analyzed very late-time HST observations of the faint, unusual Type Iax supernova SN 2012Z — taken more than 2500 days after it exploded. SN 2012Z is the only white-dwarf supernova with a detected companion star before the explosion, and it remains brighter than that pre-explosion source. Our analysis showed that this long-lasting light requires an additional energy source, most likely a “bound remnant” surviving from the incomplete explosion. The paper (M. Schwab, L. A. Kwok, et al. 2025) is available on arXiv.
Type Ia supernovae (SNe Ia) are the cosmic explosions that revealed the accelerating expansion of the universe and the existence of dark energy. They also play a central role in enriching galaxies with iron-group elements (Fe, Co, Ni). Yet, despite their importance, what we truly know is surprisingly limited: SNe Ia are thermonuclear explosions of carbon–oxygen white dwarfs in binary systems—but the exact paths to explosion remain uncertain.
The classic “textbook” model is the single-degenerate scenario (left video), in which a white dwarf accretes material from a non-degenerate (regular) companion star until it nears the Chandrasekhar mass limit (≈1.4 M☉) and explodes. However, mounting evidence—such as the absence of the companion star in pre-explosion images and the lack of hydrogen or helium in SN Ia spectra—suggests this channel cannot explain all (or even most) observed events. A compelling alternative is the double-degenerate scenario (right video), where two white dwarfs merge or tidally disrupt one another, triggering a thermonuclear runaway.
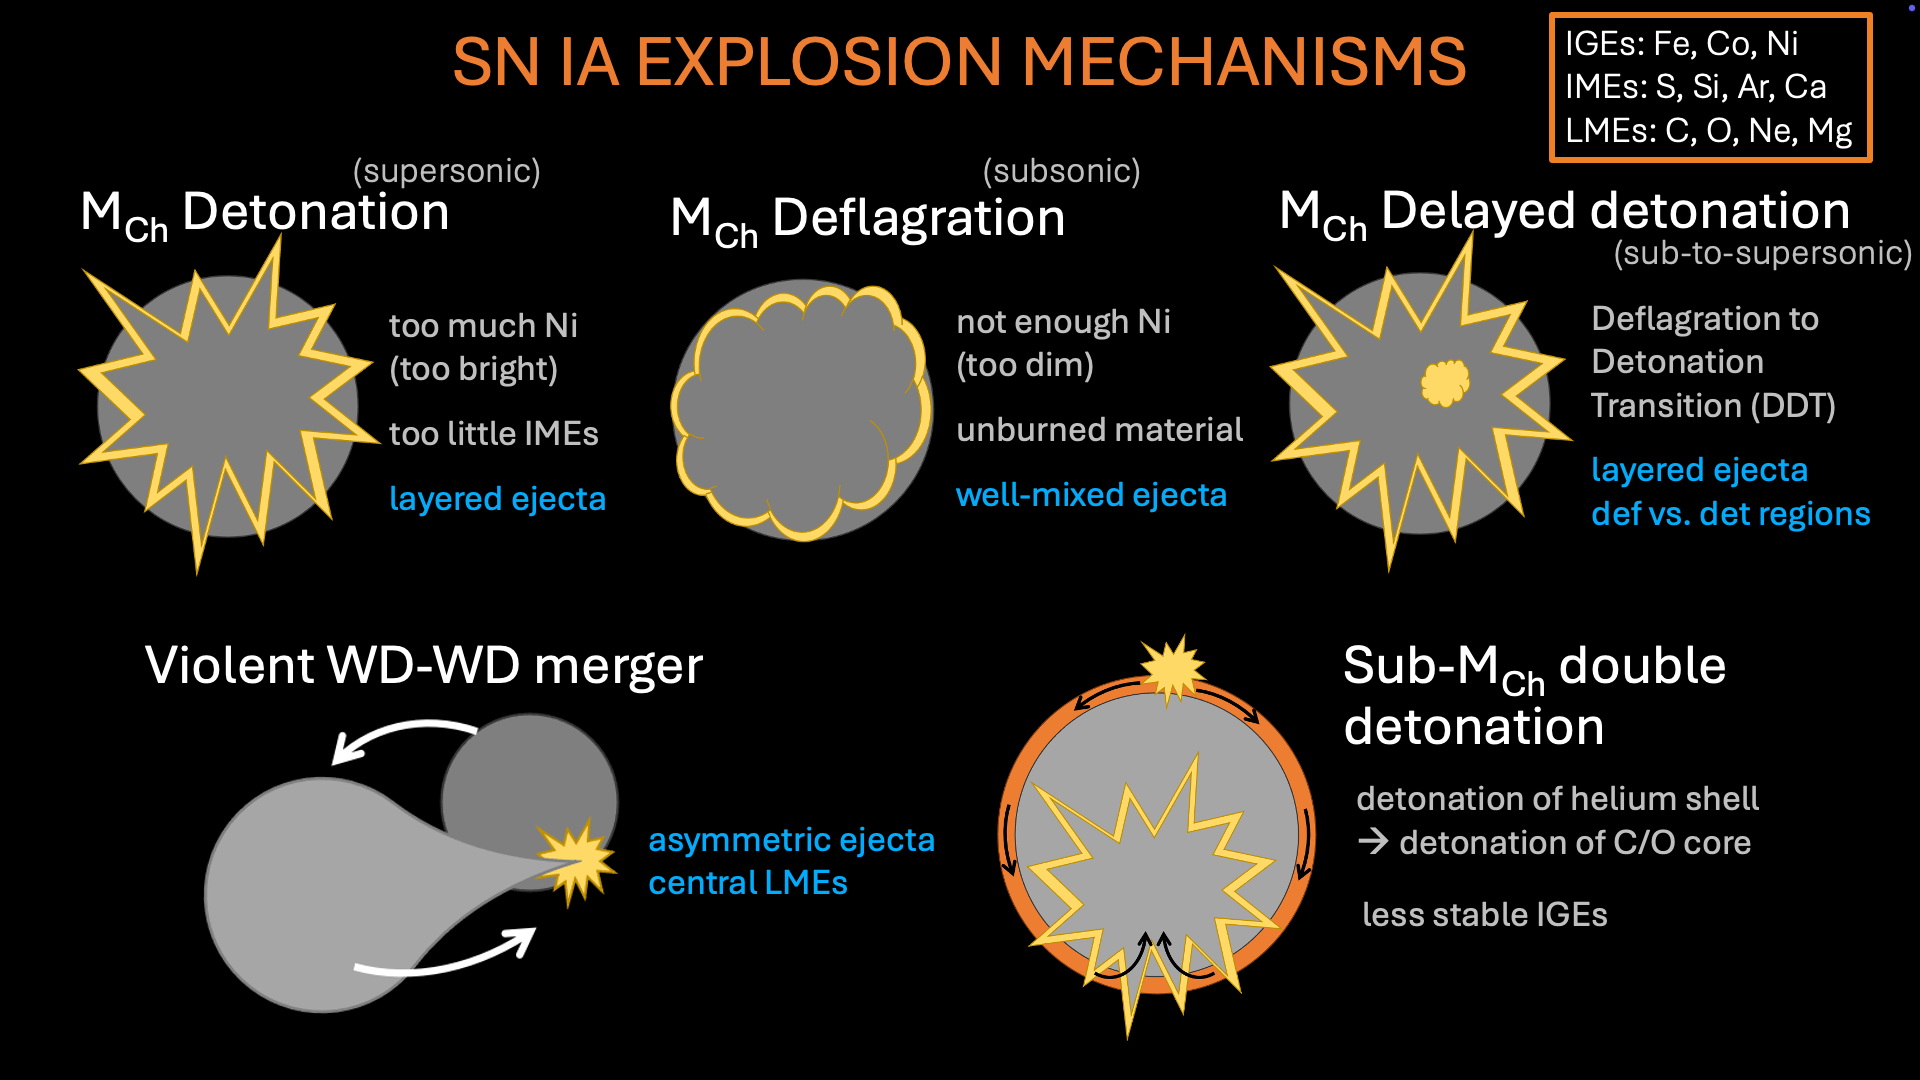
Beyond the question of progenitors, we also don’t fully understand how the explosion itself ignites and evolves. The image above illustrates several possible pathways. A Chandrasekhar-mass detonation—a purely supersonic flame front—burns the white dwarf at very high densities, producing too much nickel and yielding supernovae far brighter than observed (this scenario is effectively ruled out). At the other extreme, a pure deflagration involves subsonic burning: the star expands as it reacts to the energy release, leading to turbulent mixing and incomplete burning. The result is a lower-density, nickel-poor explosion—likely the mechanism behind the faint, peculiar Type Iax supernovae.
Between these extremes lies the Chandrasekhar-mass delayed detonation model, where the burning begins subsonically (deflagration) but later transitions to a supersonic detonation. This allows the white dwarf to expand before the detonation front sweeps through, achieving the right densities to produce a typical amount of nickel. Delayed detonations remain a leading explanation for normal SNe Ia.
Recent simulations have also shown that white dwarfs can explode without ever reaching the Chandrasekhar mass. In these sub-Chandrasekhar models, a thin helium layer on the surface can ignite first, wrapping around the star and sending a compression wave into the carbon–oxygen core. The resulting double detonation—helium followed by carbon—can reproduce the brightness and spectra of many observed SNe Ia.
Finally, if two sub-Chandrasekhar white dwarfs in a binary system are massive enough, the less-dense secondary can be tidally disrupted, and the resulting stream of material directly impacts the primary. This violent merger triggers a detonation in the primary—and can partially or fully ignite the secondary as well—producing a viable pathway to some rarer types of thermonuclear supernovae.
These are just a few of the many models under active study; each comes in multiple “flavors” and continues to evolve as new observations and simulations push the field forward.
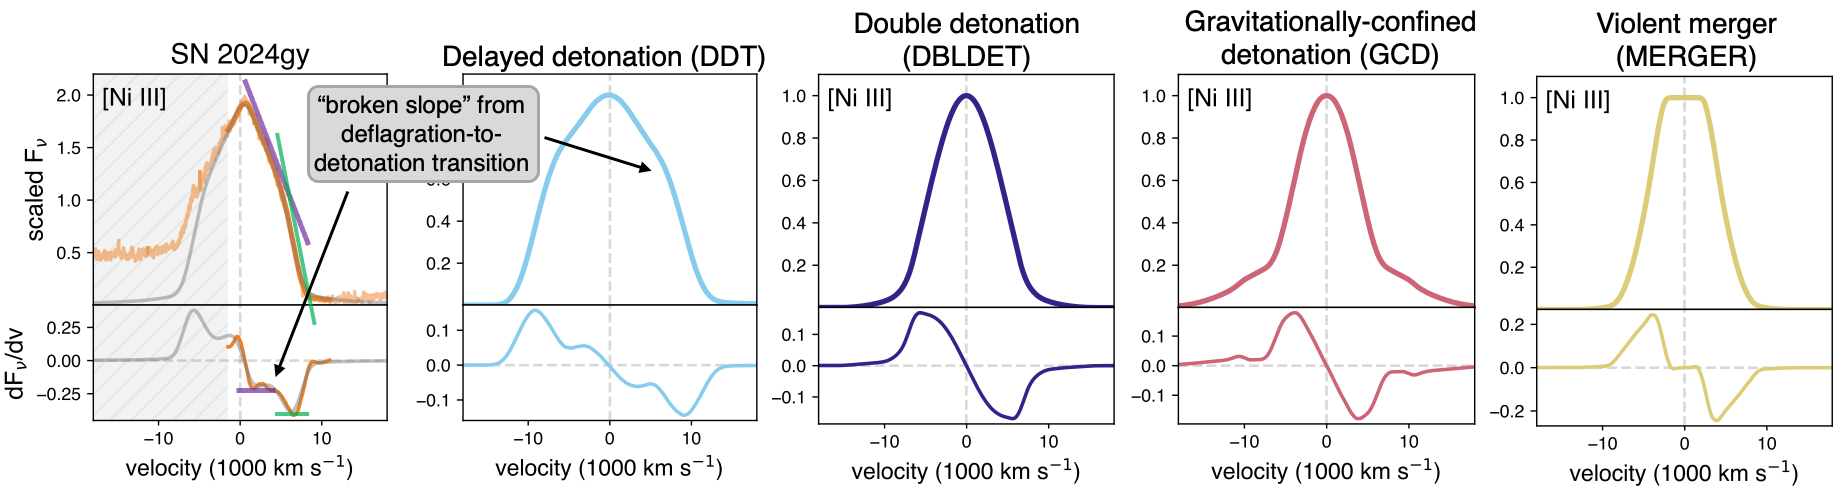
Our JWST observations of the normal Type Ia supernovae SN 2022aaiq and SN 2024gy reveal distinctive nickel features that trace conditions deep in the explosion core. In both events, we detect a narrow central core of emission in the [Ni II] line (singly ionized nickel), indicating enhanced production of stable 58Ni at very high densities—conditions naturally achieved in near-Chandrasekhar-mass white dwarfs. In SN 2024gy, we also observe a “broken-slope” profile in the [Ni III] emission that matches predictions from delayed detonation models, arising from the separation between the deflagration (slow burning) and detonation (fast burning) ashes. Together, these signatures point toward a near-Chandrasekhar-mass white dwarf progenitor that exploded via a delayed detonation.
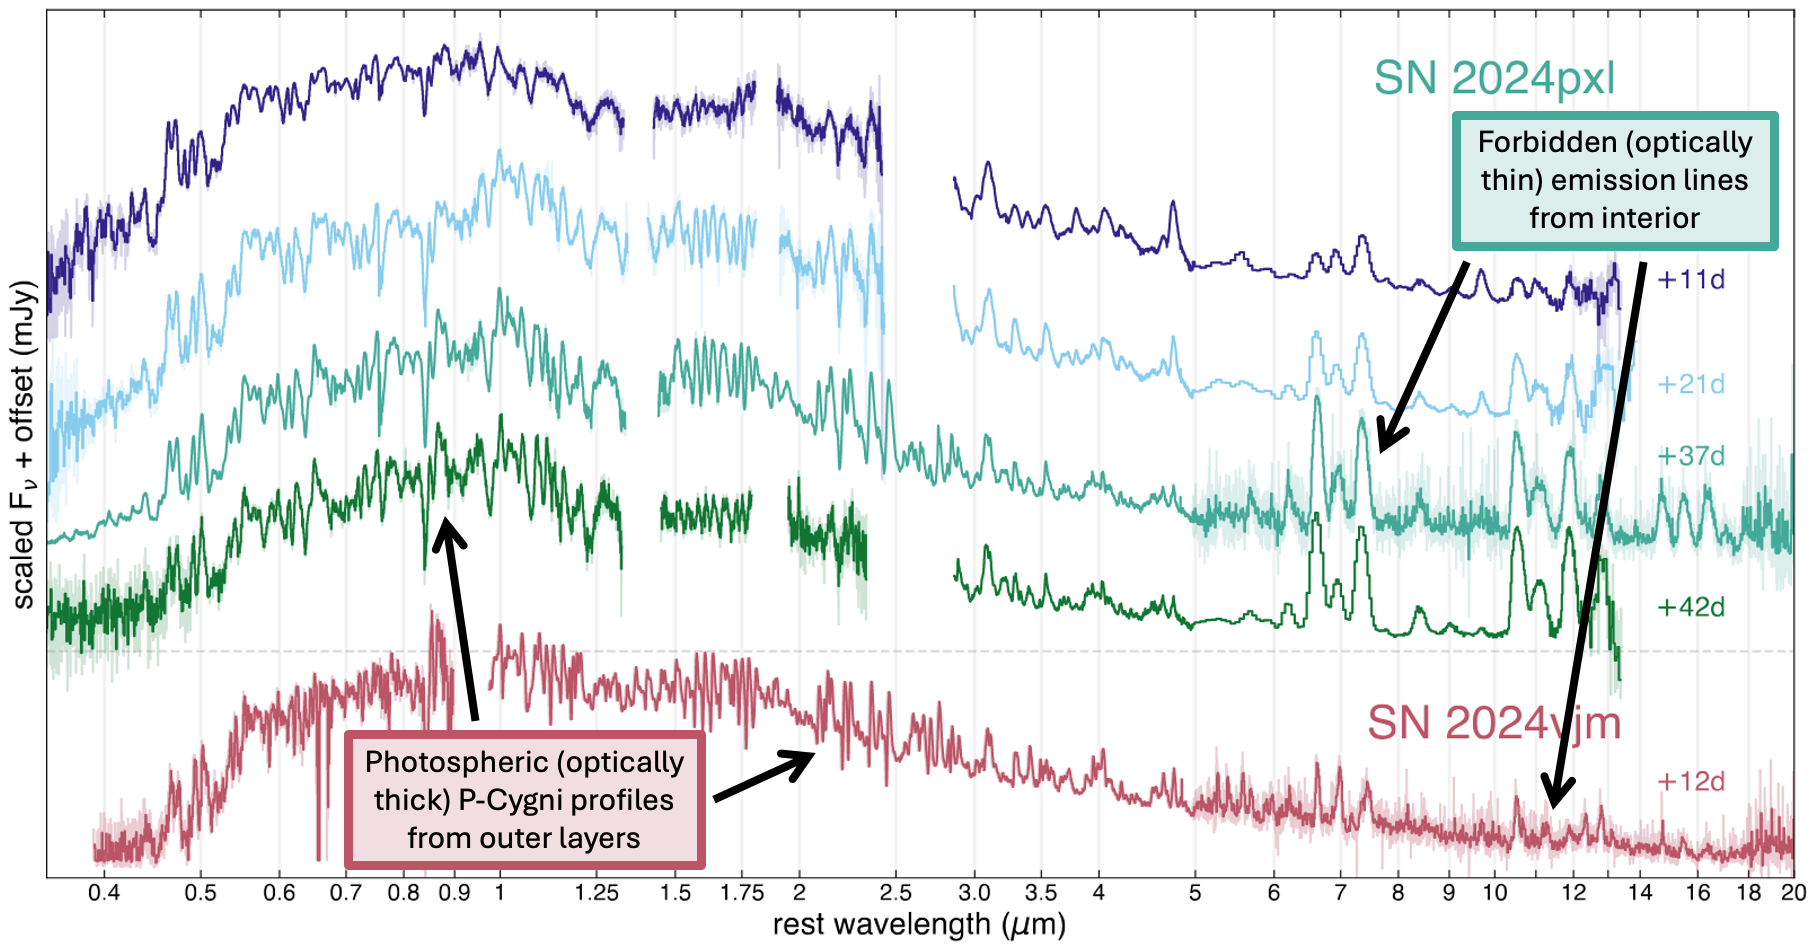
We obtained the first mid-infrared (MIR) spectra of the faint, peculiar Type Iax (SN Iax) subclass—as well as the first MIR spectra observed at such early phases (beginning about 10 days after maximum brightness). These early observations show that the MIR becomes optically thin much sooner than the optical, allowing us to probe the inner ejecta while optical spectra still trace the outer layers. SN Iax events display narrow lines due to their lower-energy explosions and slower ejecta. SN 2024pxl has intermediate luminosity within the subclass, while SN 2024vjm is extremely faint—nearly 100 times dimmer than the brightest SN Iax. Yet both show remarkably similar panchromatic spectra with well-mixed ejecta, a hallmark of pure deflagration (subsonic burning with turbulent mixing). Together, these results point to weak deflagrations of near-Chandrasekhar-mass white dwarfs as the origin of SN Iax.
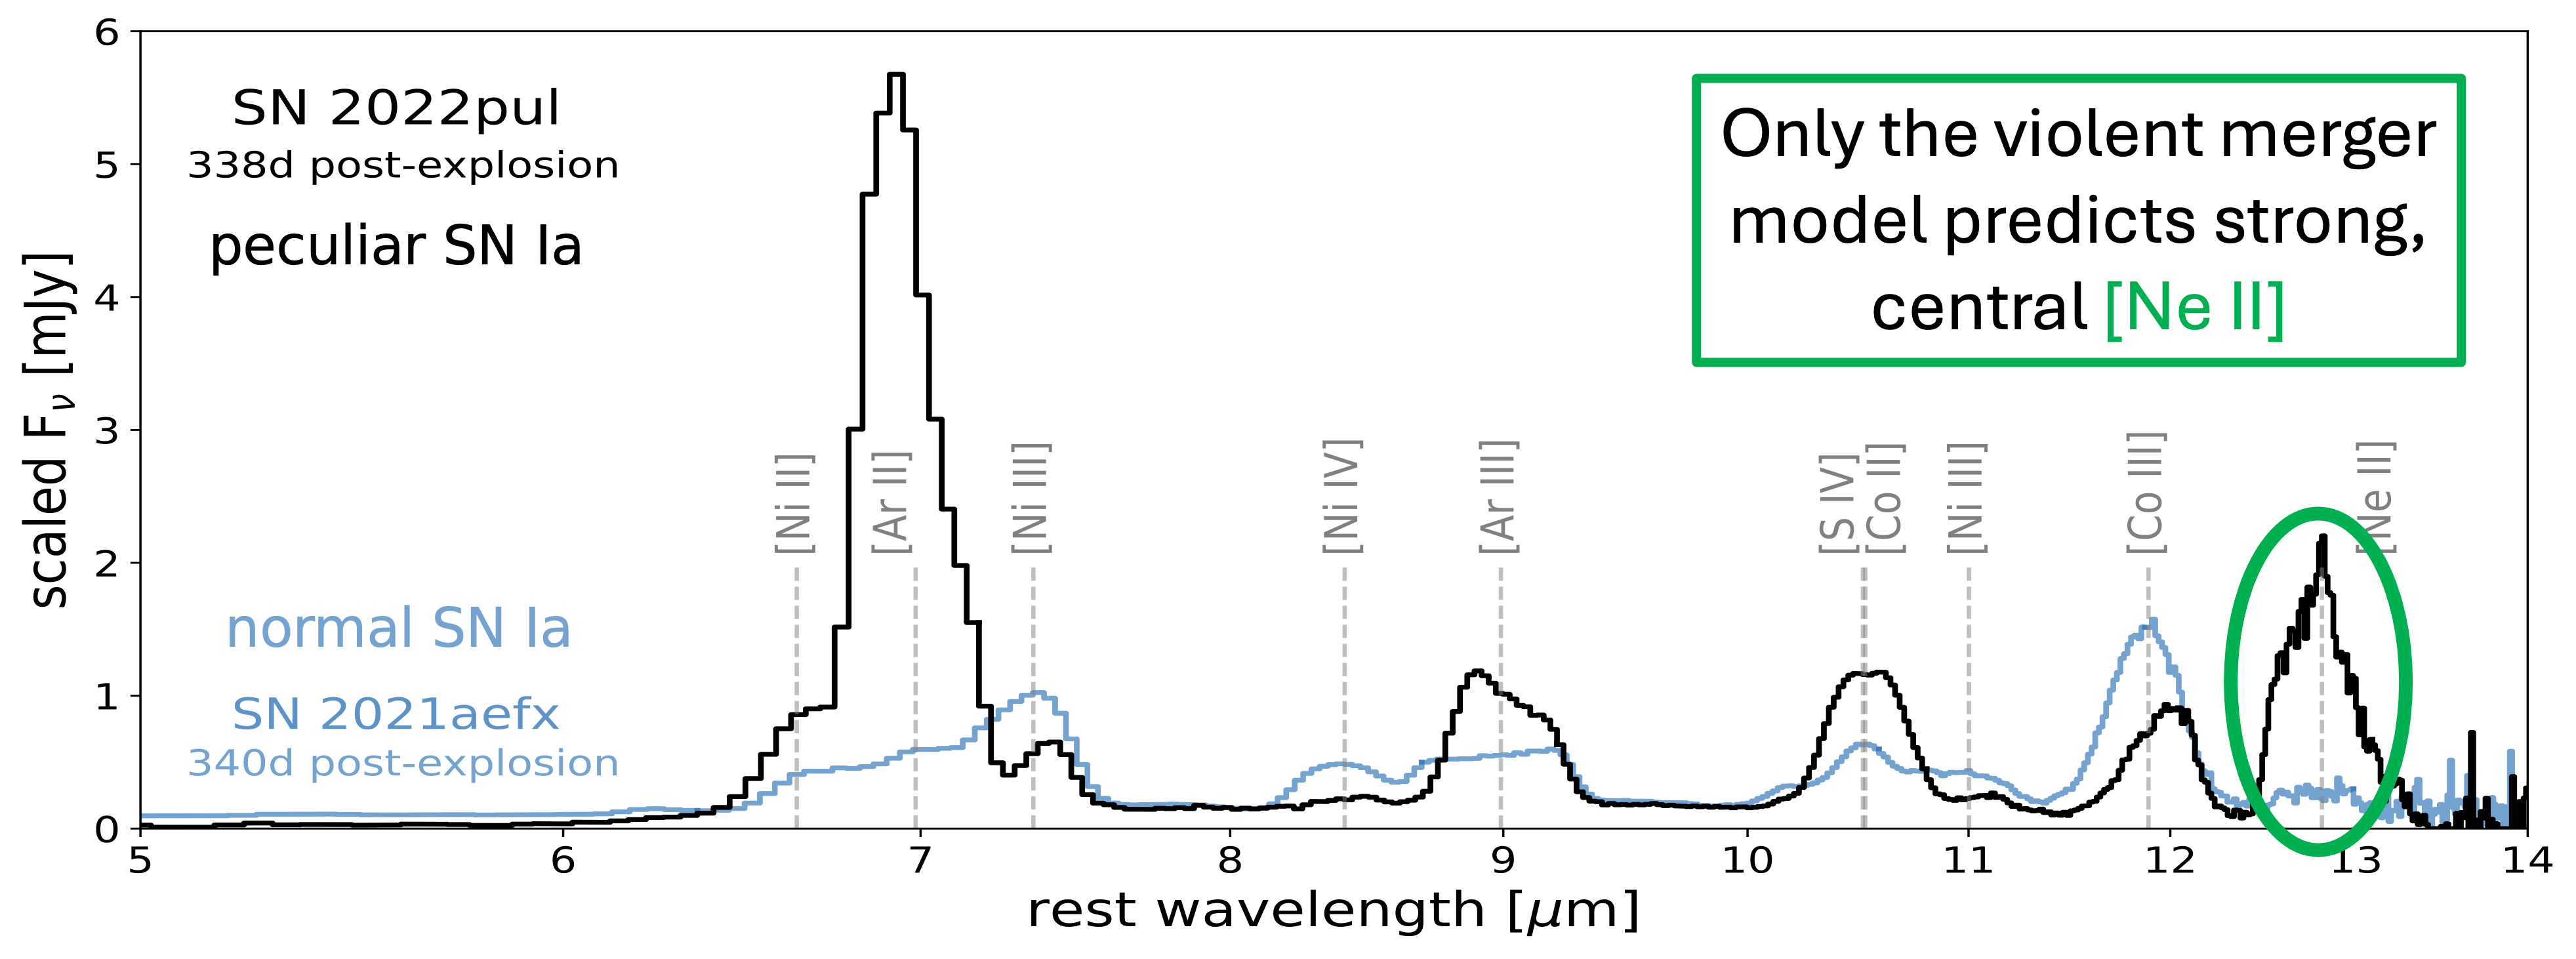
We obtained the first mid-infrared (MIR) spectrum of a 03fg-like ("super-Chandrasekhar") Type Ia supernova with JWST observations of SN 2022pul. Compared to the normal SN Ia 2021aefx, SN 2022pul shows stronger argon and calcium emission, weaker iron-group emission, and the first clear detection of neon in a SN Ia. Its broad, centrally peaked [Ne II] line at 12.8 μm and large-scale ejecta asymmetries support a violent merger of two sub-Chandrasekhar-mass white dwarfs as the origin of this event and the 03fg-like subclass as a whole.
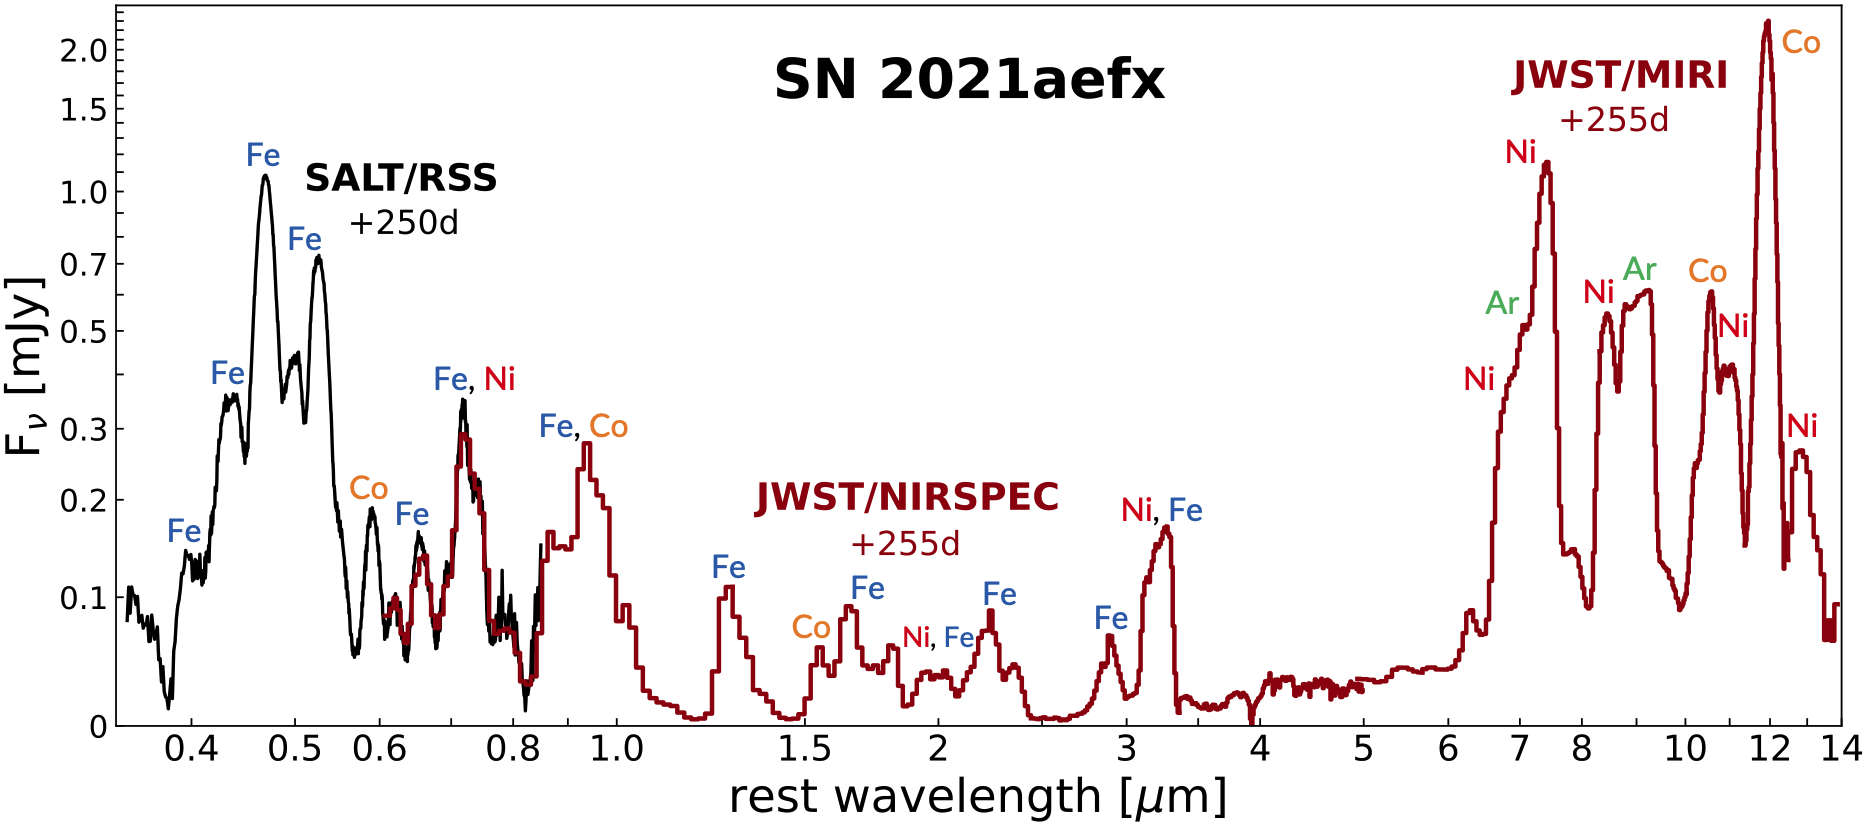
Our first JWST observations were of the normal Type Ia supernova SN 2021aefx (August 2022). We detected argon, an intermediate-mass element, showing a flat-topped profile that extends to higher velocities than the iron-group elements (Fe, Ni, Co), indicating that the ejecta is stratified. This layering demonstrates that a detonation—a supersonic propagation of the burning front—must have been involved. We also identified multiple strong stable nickel (58Ni) emission lines, requiring the high-density burning expected in a near-Chandrasekhar-mass white dwarf.